

Insulin Resistance and Heart Disease: The Connection Most Doctors Never Fully Explain
Insulin Resistance and Heart Disease: The Connection Most Doctors Never Fully Explain
Most people think of insulin as a diabetes issue. Your doctor checks your fasting blood sugar, it comes back normal, and the conversation ends there.
But insulin resistance is a cardiovascular issue just as much as it is a metabolic one. And by the time fasting blood sugar looks abnormal, the underlying process has often been active for a long time.
Understanding the chain of events that connects insulin resistance to heart disease helps explain why so many people develop cardiovascular problems without ever being told they had a blood sugar issue.
How Does Insulin Resistance Damage the Cardiovascular System?
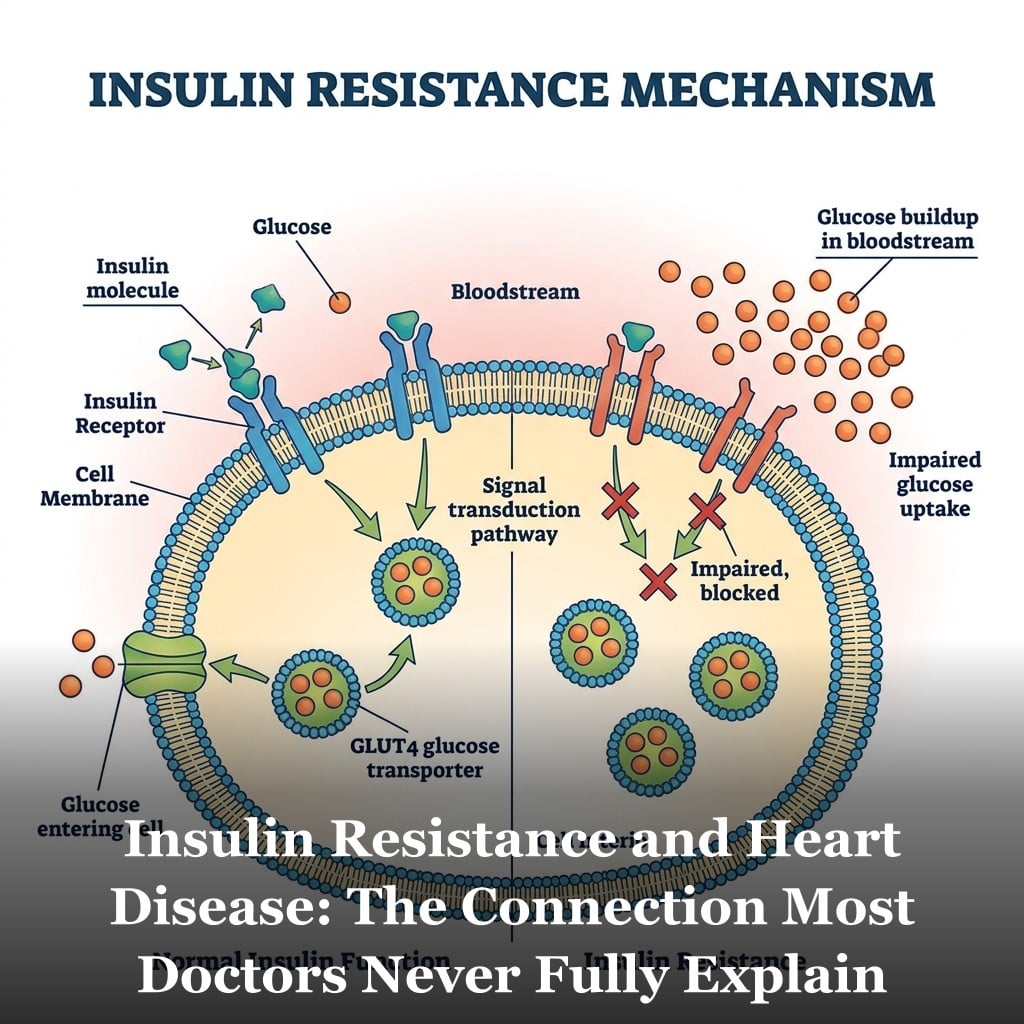
Here is the basic sequence. When you eat carbohydrates, blood sugar rises. The pancreas releases insulin to signal cells to absorb that glucose for energy. In a healthy system, cells respond promptly, blood sugar returns to baseline, and insulin levels fall.
In insulin resistance, cells stop responding as readily to that signal. The pancreas compensates by producing more insulin. Blood sugar may still look normal on a fasting test because the pancreas is working overtime to keep it there. But circulating insulin levels are elevated. And that elevated insulin has effects throughout the body.
On the arterial wall specifically, elevated insulin promotes the proliferation of smooth muscle cells in the vessel wall. This contributes to arterial thickening and stiffening over time. Insulin also stimulates the sympathetic nervous system, which raises heart rate and constricts blood vessels. And it causes the kidneys to retain more sodium, which increases blood volume and contributes to pressure on the arterial wall. These mechanisms help explain why insulin resistance is associated with elevated blood pressure even before blood sugar becomes abnormal.
Insulin resistance also drives inflammation. Elevated insulin activates NF-kB, the same molecular switch discussed in the context of chronic low-grade inflammation. It increases production of pro-inflammatory cytokines and promotes oxidative stress in the arterial wall. This combination accelerates the same plaque-building process described in that article.
There is also the visceral fat connection. Insulin resistance promotes fat storage in the visceral compartment, around the organs rather than under the skin. Visceral fat is metabolically active tissue that secretes inflammatory cytokines continuously. More visceral fat means more inflammatory load on the arteries. And more visceral fat worsens insulin resistance, creating a self-reinforcing cycle. This is one reason waist circumference is now considered a more relevant cardiovascular marker than body weight alone. It is also one of the five criteria for metabolic syndrome.
How Does Insulin Resistance Affect Cholesterol and Blood Pressure?
Insulin resistance reshapes the lipid profile in a specific and particularly unfavorable pattern. It tends to raise triglycerides, lower HDL, and shift LDL toward smaller, denser particles.
Small dense LDL is more dangerous than large buoyant LDL. It penetrates the arterial wall more easily, is more susceptible to oxidation once inside, and stays in circulation longer because it doesn’t bind as well to LDL receptors in the liver. A person with insulin resistance can have a total LDL number that looks acceptable on a standard panel while carrying a particle profile that is significantly more atherogenic than that number suggests.
HDL tells a similar story. Insulin resistance consistently drives HDL lower. HDL helps transport cholesterol away from arterial walls and carries anti-inflammatory properties. Lower HDL means less of that protective function. You can go deeper on this in the article on HDL cholesterol and heart health.
The triglyceride picture rounds it out. Elevated insulin signals the liver to produce more triglycerides and package them into VLDL particles. High triglycerides, especially combined with low HDL, is one of the most reliable clinical signatures of insulin resistance. A triglyceride to HDL ratio above 3.0 is widely used by metabolic researchers as a practical indicator of likely insulin resistance, even when fasting glucose looks normal.
On the blood pressure side, the mechanisms described earlier, sodium retention, sympathetic activation, and arterial stiffening, all contribute to elevated pressure over time. Research consistently finds that insulin resistance precedes the development of elevated blood pressure in longitudinal studies. The two conditions tend to arrive together because they share the same upstream drivers, but insulin resistance is often earlier in the sequence. This sits at the heart of why multiple cardiovascular risk factors so often cluster together.
What Are the Signs to Watch For?
The most useful clinical indicators of insulin resistance don’t require a specialized test. They come from a standard metabolic panel plus a few additional markers your doctor can easily order.
Fasting triglycerides above 100 mg/dL combined with HDL below 50 mg/dL in women or below 40 mg/dL in men is a strong pattern. The triglyceride-to-HDL ratio above 2.0 to 3.0 is associated with insulin resistance in multiple population studies.
Fasting insulin level. This is rarely ordered on a standard panel but provides direct information. A fasting insulin above 10 uIU/mL is a flag worth discussing with your doctor, even with normal fasting glucose.
Fasting glucose in the 90 to 99 mg/dL range. This is technically normal by standard definitions, but research has found that cardiovascular risk increases incrementally across the upper end of the normal range. This is covered in detail in the article on why a normal fasting blood sugar can still carry cardiovascular risk.
Waist circumference. Greater than 40 inches in men or 35 inches in women is the clinical threshold used to flag visceral obesity in metabolic syndrome criteria. But research suggests risk begins to increase before those cutoffs.
Post-meal blood glucose. A continuous glucose monitor or a simple finger-stick test two hours after eating can reveal post-meal spikes that a fasting test misses entirely. Some researchers consider post-meal glucose excursions above 140 mg/dL a meaningful marker of insulin resistance even when fasting glucose is normal. Magnesium deficiency is one factor that appears to worsen insulin sensitivity and is worth addressing independently.
Insulin resistance is not a diagnosis most doctors deliver clearly. It doesn’t have a billing code the way diabetes does. It often doesn’t trigger a conversation because the standard tests aren’t designed to catch it early. But it is one of the most consequential upstream drivers of cardiovascular disease. Understanding it gives you the ability to look for the right markers, ask the right questions, and make changes that address the problem before it becomes harder to reverse.

Frequently Asked Questions
Can I have insulin resistance with a normal fasting blood sugar?
Yes. This is actually the common scenario in the early stages. When cells become resistant to insulin, the pancreas produces more of it to compensate. Blood sugar stays normal while insulin is elevated. Standard fasting glucose tests measure blood sugar, not insulin. You can have significant insulin resistance for years before fasting glucose rises above 100. Asking your doctor for a fasting insulin level gives you more direct information about where you stand.
Is insulin resistance reversible?
Research consistently shows that insulin resistance is highly responsive to lifestyle modification. Reducing refined carbohydrate and added sugar intake, increasing physical activity, losing visceral fat, and improving sleep quality have all been shown in clinical trials to improve insulin sensitivity measurably. How much improvement is achievable depends on how long the condition has been present and individual genetic factors, but the direction of change is reliable across the research.
Does insulin resistance cause high cholesterol?
It causes a specific pattern of lipid changes. Insulin resistance tends to raise triglycerides, lower HDL, and shift LDL toward smaller, denser particles that are more atherogenic. Total LDL may not change dramatically, which is why a standard cholesterol panel can look acceptable even when the particle profile is concerning. A more complete lipid assessment would include triglycerides, HDL, the triglyceride-to-HDL ratio, and ideally LDL particle size or number (ApoB).
What is the best test to check for insulin resistance?
A fasting insulin level combined with fasting glucose is the most practical starting point. The HOMA-IR calculation uses these two numbers to estimate insulin resistance. A glucose tolerance test with insulin measurements at 30, 60, and 120 minutes gives a fuller picture of how your body handles a glucose load. Continuous glucose monitoring can reveal post-meal spikes that fasting tests miss. None of these are typically part of a standard annual physical, so you need to ask specifically.
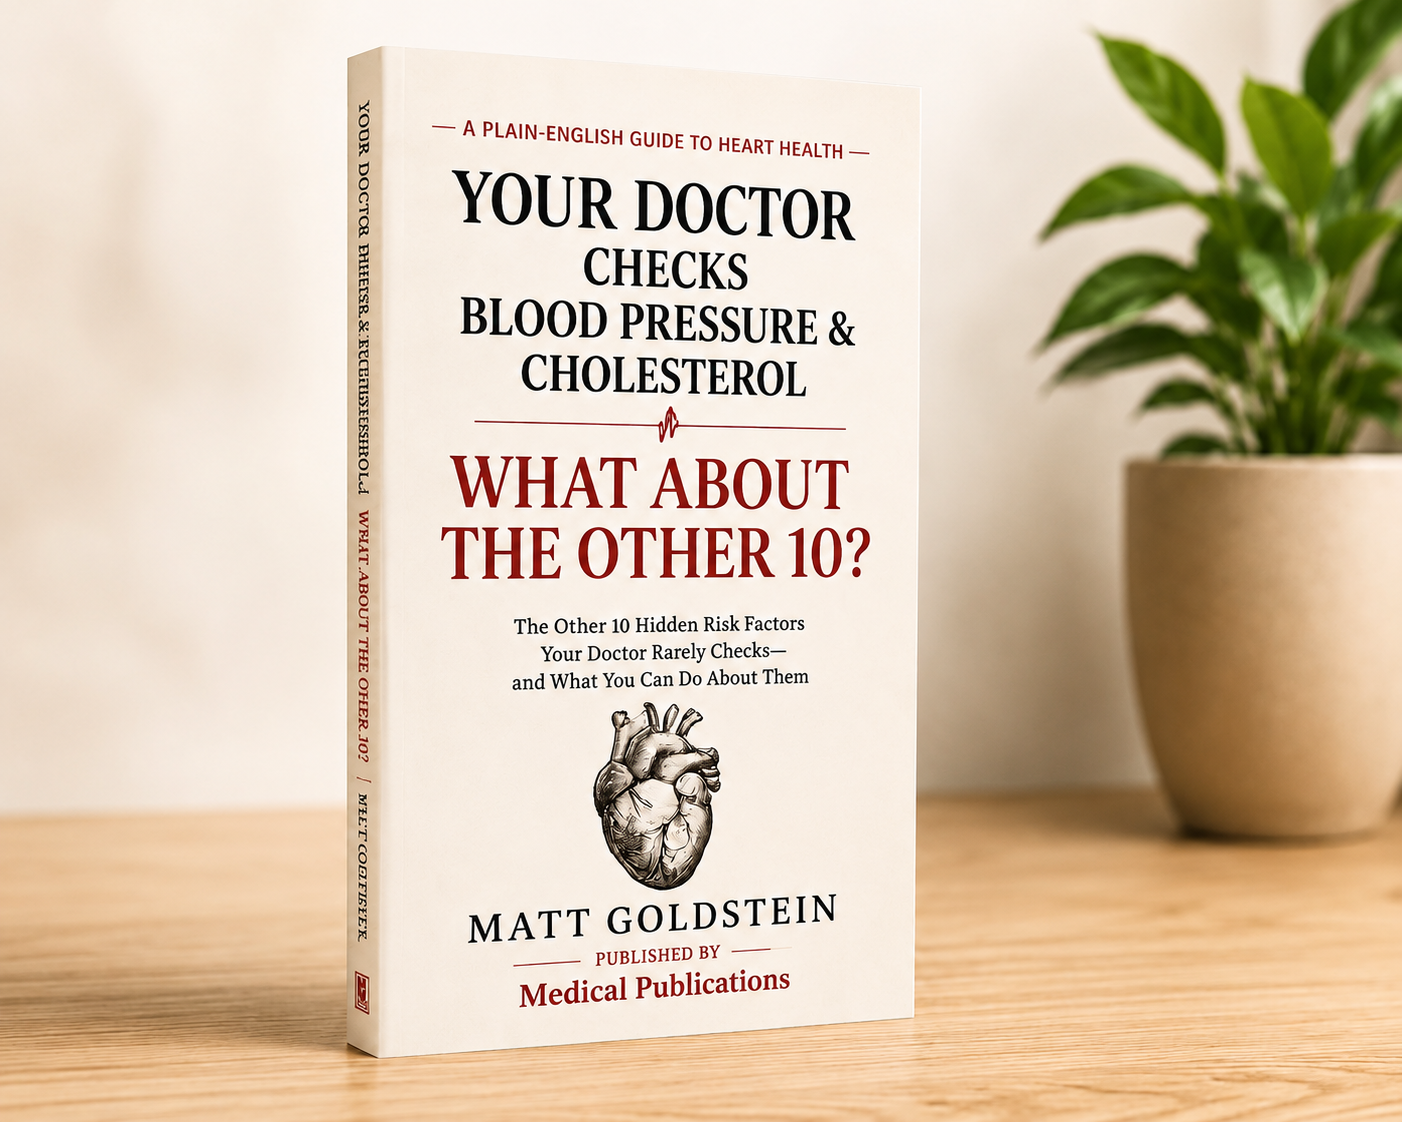
Get Your Free Heart Book
Your Doctor Checks Blood Pressure & Cholesterol: What About the Other 10?
Most heart attacks happen to people whose last checkup came back “fine.” This book covers the 12 risk factors your doctor may not be testing — in plain English, backed by research.
Get the Free Book →* These statements have not been evaluated by the Food and Drug Administration. This product is not intended to diagnose, treat, cure, or prevent any disease.