
Why a Normal Fasting Blood Sugar Can Still Put Your Heart at Risk
Why a Normal Fasting Blood Sugar Can Still Put Your Heart at Risk

Your last blood test came back normal. Fasting glucose 94 mg/dL. Nothing to worry about.
For most doctors, that’s the end of the blood sugar conversation. You’re not prediabetic. You’re not diabetic. Move on.
But some researchers have been asking a different question: within the normal range, does where you fall matter? And what happens to your arteries between meals, when fasting glucose tells you nothing at all?
The answers are worth knowing, especially if cardiovascular health is a priority.
Does Where You Fall Within the Normal Range Actually Matter?
The normal fasting glucose range runs from roughly 70 to 99 mg/dL. That 30-point span is treated as a single category — normal — even though it represents meaningfully different metabolic states.
Several large observational studies have found that cardiovascular risk increases incrementally across the upper portion of the normal range. A study published in the European Heart Journal (Emerging Risk Factors Collaboration, 2010) analyzed individual data from nearly 700,000 people across 97 prospective studies. It found a continuous, graded association between fasting glucose and cardiovascular risk beginning well below the diabetic threshold. The relationship was present even within the so-called normal range.
A separate analysis using the EPIC-Norfolk cohort study followed over 20,000 men and women for approximately 11 years. It found that fasting glucose between 86 and 99 mg/dL was associated with higher cardiovascular risk compared to fasting glucose below 86, even after adjusting for other risk factors. The gradient was modest but consistent.
The proposed mechanism connects directly to insulin resistance. A fasting glucose in the 90 to 99 range often reflects a compensatory state where the pancreas is producing elevated insulin to keep blood sugar within the normal window. That elevated insulin has the arterial and inflammatory effects described in the insulin resistance article. The blood sugar looks fine because the pancreas is working hard to make it look fine. But the metabolic stress is already present.
This is not a reason to panic if your fasting glucose is 95 mg/dL. It’s a reason to look at the full picture rather than stopping at a single number. What do your triglycerides look like? Your HDL? Your waist circumference? These together tell a more complete story than fasting glucose alone. The full cardiovascular risk factor framework is built on exactly this principle.
What Does Fasting Glucose Miss Entirely?
This is arguably the bigger issue. Fasting glucose is measured after at least 8 hours without food. It captures one snapshot of blood sugar regulation. It tells you nothing about what happens during the other 16 hours of your day when you’re eating.
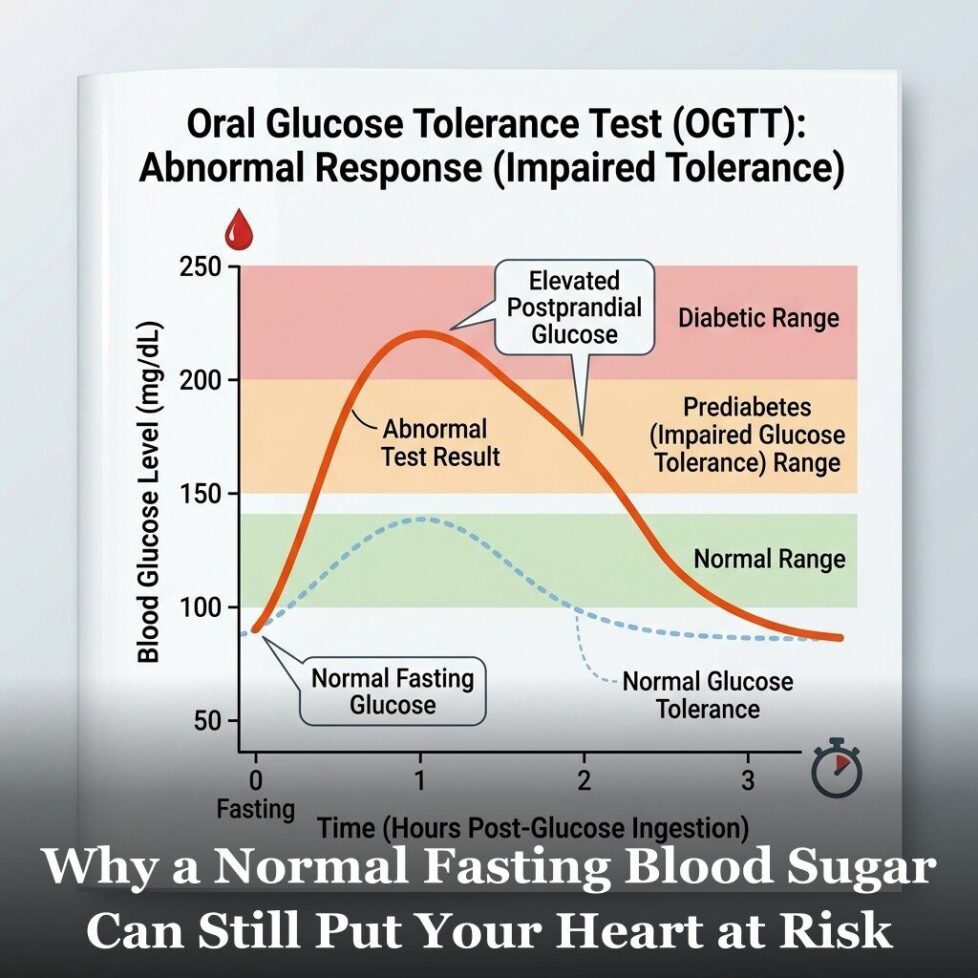
After a meal, blood sugar rises. In a healthy metabolic state, it peaks modestly and returns to baseline within 1 to 2 hours. In a person with early insulin resistance, the peak is higher and the return to baseline is slower. Blood glucose may remain elevated for 3 or 4 hours after a meal before coming back down.
These post-meal spikes, called postprandial glucose excursions, expose the arterial endothelium to elevated glucose repeatedly throughout the day. Research has found that acute spikes in blood glucose produce a measurable burst of oxidative stress in endothelial cells. Over years of repeated exposure, this contributes to endothelial dysfunction, the same process that impairs nitric oxide production and initiates the inflammatory cascade described in the article on chronic arterial inflammation.
A landmark study by Ceriello et al. found that post-meal glucose spikes produced greater oxidative stress in the arterial wall than sustained moderate hyperglycemia. The implication is that the pattern of blood sugar, how high it spikes and how quickly it returns to baseline, matters as much as the average level.
A person with a fasting glucose of 90 mg/dL can still be having post-meal spikes to 160 or 180 mg/dL after a large refined carbohydrate meal. Their fasting test would look completely normal. Their arteries are experiencing a very different reality throughout the day.
What Tests Go Deeper?
Several tests provide more complete information about blood sugar regulation than a standard fasting glucose alone.
Fasting insulin. This is the most practical addition to a standard panel. Fasting insulin directly measures how hard the pancreas is working. A fasting glucose of 92 combined with a fasting insulin of 15 uIU/mL tells a very different story than the same glucose with a fasting insulin of 5. The HOMA-IR calculation uses both numbers to estimate insulin resistance. Asking your doctor to add fasting insulin to your next panel is a reasonable and low-cost step.
Post-meal glucose testing. A finger-stick glucose test 1 hour and 2 hours after a typical meal gives you information about your postprandial response. Some metabolic health researchers consider a 1-hour post-meal glucose above 140 mg/dL a meaningful signal of impaired glucose metabolism even when fasting glucose is normal. This is an inexpensive self-test that provides data your annual blood work never captures.
Continuous glucose monitoring (CGM). Devices like the Libre or Dexcom can be worn for 2 weeks without a prescription in most US states. They provide a continuous picture of glucose across the full day and night: fasting levels, post-meal spikes, the duration of elevated glucose after eating, and nocturnal patterns. For someone wanting a complete picture of their glucose metabolism, a 2-week CGM period is one of the most information-dense tests available at a relatively modest cost.
Hemoglobin A1c. More informative than fasting glucose alone, but with the limitations described above. Still worth having as part of a complete cardiovascular and metabolic panel.
Oral glucose tolerance test (OGTT) with insulin measurements. The gold standard for identifying impaired glucose metabolism and insulin resistance. You drink a standard glucose solution and blood is drawn at 30, 60, and 120 minutes to measure both glucose and insulin. The shape of the insulin curve reveals compensatory hyperinsulinemia even when glucose looks normal. This is the test most likely to catch early insulin resistance that a fasting glucose misses. It requires a lab visit and is more involved than a standard blood draw, but it’s the most complete picture available short of a clamp study. Magnesium status is worth checking alongside these tests, as magnesium plays a role in insulin receptor sensitivity.
The overarching point is that a single fasting glucose number, even a normal one, is a narrow window into a complex, dynamic system. It captures one moment in time, under fasting conditions, and applies a binary normal/abnormal label to it. Cardiovascular risk from blood sugar dysregulation doesn’t work that way. It builds gradually, through repeated exposures, across the full range of metabolic states your body moves through every day. The tests above give you a more complete picture of that reality. And a more complete picture gives you the ability to act earlier, when the trajectory is most changeable. This is exactly what the full cardiovascular risk factor framework is built around.

Frequently Asked Questions
My fasting glucose is 95. Should I be worried?
Not worried, but informed. A fasting glucose of 95 is within the normal range by standard definitions. Some research suggests the upper portion of the normal range is associated with incrementally higher cardiovascular risk compared to optimal levels below 85. That doesn’t mean something is wrong — it means it’s worth looking at the broader context. What do your fasting triglycerides and HDL look like? Your waist circumference? Your fasting insulin? These together tell a more complete story. A single number in isolation is a starting point, not a conclusion.
What is a healthy post-meal blood sugar level?
Most clinical guidelines consider a 2-hour post-meal glucose below 140 mg/dL normal. Some metabolic researchers consider below 120 at 2 hours a better target for optimal cardiovascular health. A 1-hour post-meal level below 140 is associated with lower risk in several studies. What matters most is both the peak and how quickly glucose returns to baseline. A sharp spike that resolves quickly is less concerning than a prolonged elevation that stays elevated for 3 or more hours.
Can diet change post-meal glucose spikes?
Yes, significantly. Post-meal glucose response is one of the most diet-responsive metabolic variables. Reducing refined carbohydrate portions, adding fiber to meals, eating vegetables and protein before carbohydrates, and including fat and protein in every meal all blunt post-meal glucose spikes. Even the order in which you eat foods at a meal affects the glucose response. A meal with the same total carbohydrates but eaten with fiber, fat, and protein produces a meaningfully different glucose curve than eating those carbohydrates alone or first.
Is a continuous glucose monitor worth it for someone without diabetes?
For someone interested in understanding their metabolic health and cardiovascular risk, a 2-week CGM period can be genuinely useful. It shows how your body responds to specific foods, meal timing, sleep, stress, and exercise in real time. Many people are surprised to find that foods they assumed were benign produce significant spikes, and vice versa. CGMs are now available over the counter without a prescription in most US states. The cost is roughly $50 to $75 for a 2-week sensor. As a one-time diagnostic tool, many metabolic health researchers consider it worthwhile.
Get Your Free Heart Book
Your Doctor Checks Blood Pressure & Cholesterol: What About the Other 10?
Most heart attacks happen to people whose last checkup came back “fine.” This book covers the 12 risk factors your doctor may not be testing — in plain English, backed by research.
Get the Free Book →* These statements have not been evaluated by the Food and Drug Administration. This product is not intended to diagnose, treat, cure, or prevent any disease.