
The Triglyceride-to-HDL Ratio: The Heart Risk Number Already on Your Bloodwork
The Triglyceride-to-HDL Ratio: The Heart Risk Number Already on Your Bloodwork
Your last blood panel already contains a calculation that many cardiologists find more informative than LDL alone. You don’t need a new test to see it. Just divide your triglycerides by your HDL cholesterol. That single ratio has been studied as a marker for insulin resistance and cardiovascular risk.
A ratio above 3.5 has been flagged in some research as a warning sign, even in people with normal LDL numbers. Some researchers consider it one of the most accessible indicators of metabolic risk that’s already sitting in your standard bloodwork.
Here’s what the ratio measures, why it matters, and how to calculate yours right now.
What the Triglyceride-to-HDL Ratio Actually Measures
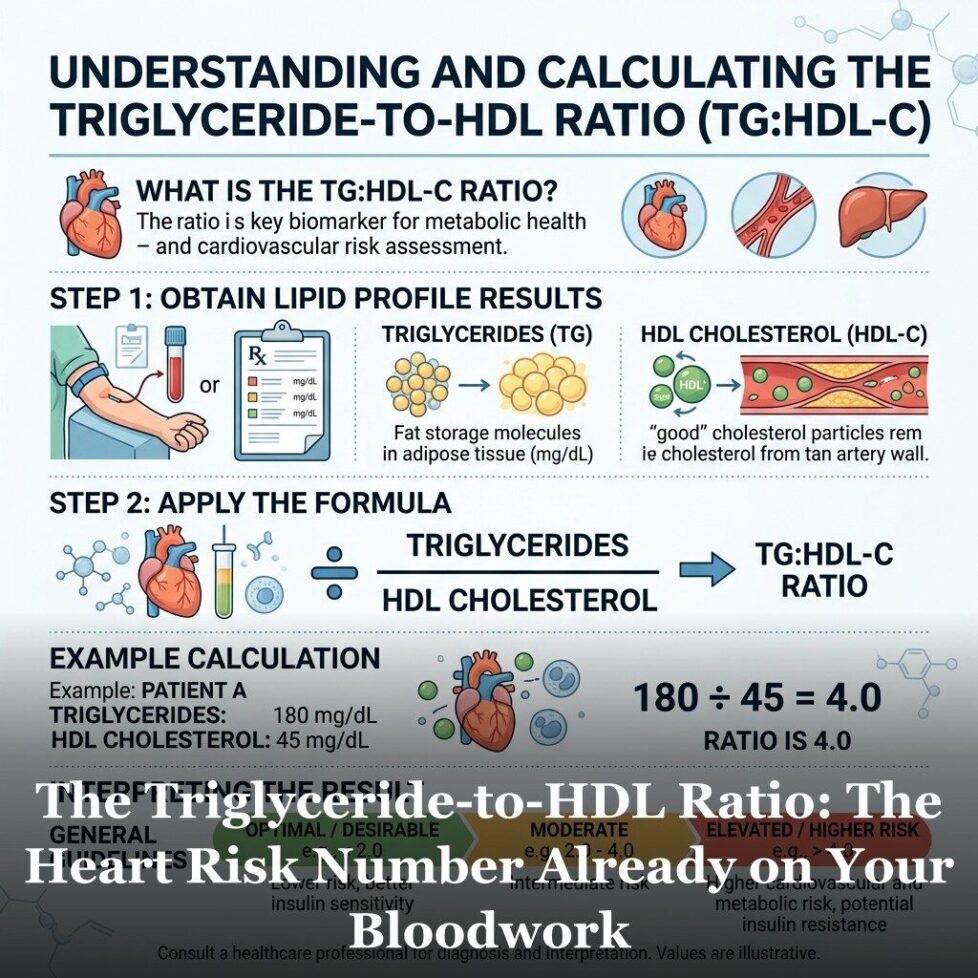
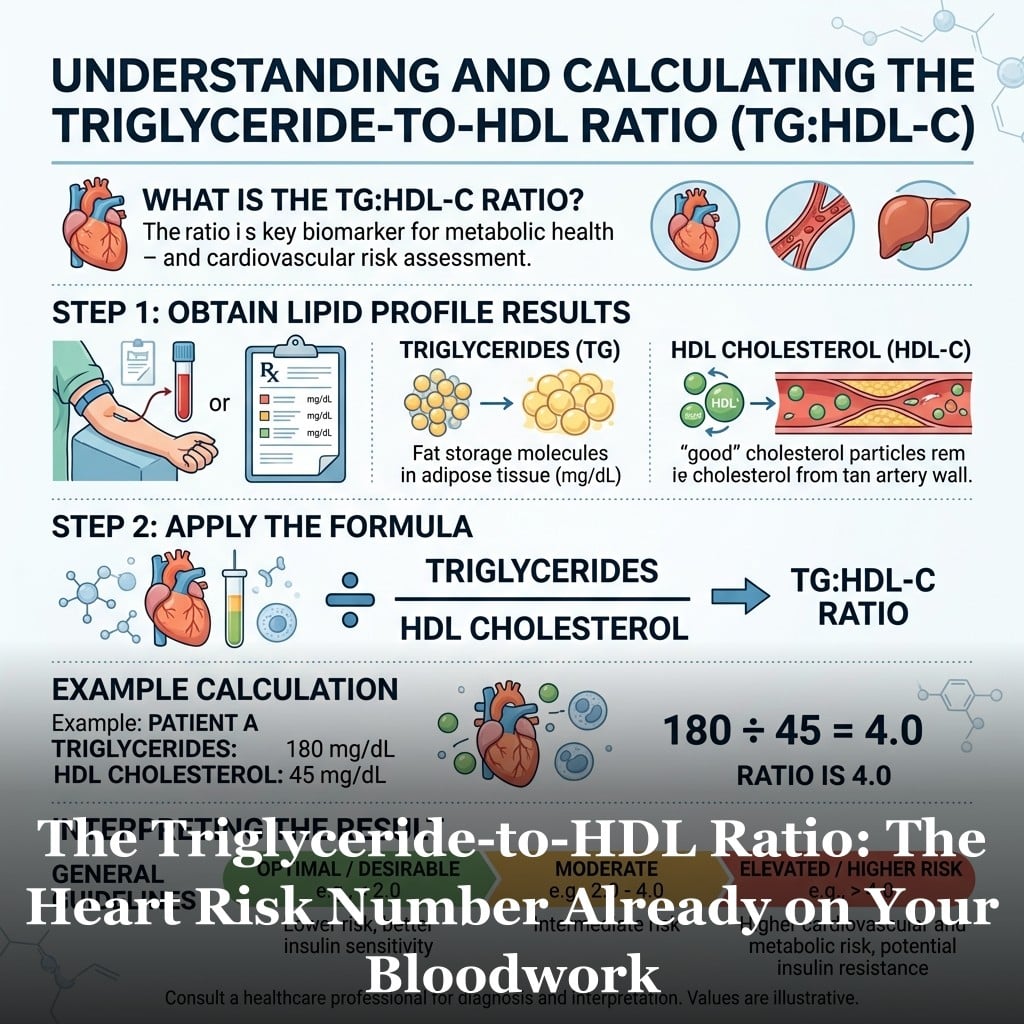
The ratio of triglycerides to HDL is a simple division: take your fasting triglyceride level and divide it by your HDL cholesterol level. If your triglycerides are 150 and your HDL is 50, your ratio is 3.0. If your triglycerides are 200 and your HDL is 40, your ratio is 5.0.
Both of those inputs are standard components of the lipid panel your doctor already orders. The ratio isn’t something most labs calculate or flag automatically, but you can calculate it yourself in seconds from any lab report.
The ratio captures something important about metabolic health because triglycerides and HDL tend to move in opposite directions. When insulin sensitivity is good, triglycerides are typically low and HDL is typically higher. When insulin resistance develops, triglycerides tend to rise while HDL tends to fall. The ratio amplifies both signals at once.
Why This Ratio Reflects Insulin Resistance
Insulin resistance is a state where cells become less responsive to insulin’s signal to absorb glucose from the blood. The body compensates by producing more insulin. Over time, this leads to chronically elevated insulin levels, which drive several metabolic changes.
One of those changes is increased triglyceride production by the liver. When insulin isn’t clearing glucose efficiently, the liver converts more of the surplus into triglycerides. At the same time, insulin resistance impairs the enzymes that transfer cholesterol to HDL particles, which pushes HDL levels down.
The result is exactly the combination the trig/HDL ratio captures: rising triglycerides and falling HDL. This is why some researchers refer to the ratio as a proxy for insulin resistance — not a direct measurement, but a useful indirect signal.
Insulin resistance can begin years before blood sugar levels look abnormal on standard tests. The fasting glucose and A1C tests your doctor orders catch it later in the process. The trig/HDL ratio may signal the earlier metabolic shift.
How to Interpret and Improve Your Ratio
Calculating your ratio is simple: find your most recent fasting triglycerides and HDL on your lab report, then divide. If the result is below 2.0, your metabolic markers in this dimension look healthy. If it’s between 2.0 and 3.5, it’s worth watching. Above 3.5 is a useful conversation to have with your doctor.
The strategies for improving the ratio target both inputs. Lowering triglycerides tends to have the largest effect: reducing refined carbohydrates, eliminating added sugar, limiting alcohol, and increasing physical activity all help. Improving HDL is harder through diet alone, but regular aerobic exercise has reliable effects on HDL levels over time.
Weight loss, particularly visceral fat reduction, tends to improve both numbers simultaneously — which is why the ratio often responds well when people make meaningful lifestyle changes.
To understand how HDL alone factors into cardiovascular risk, see our deeper look at HDL cholesterol and heart health. And for the full set of risk factors your doctor should be monitoring, the 12 cardiovascular risk factors gives you the complete framework.

Frequently Asked Questions
How do I find my triglyceride and HDL numbers on my lab report?
On a standard lipid panel, look for ‘triglycerides’ (listed in mg/dL) and ‘HDL’ or ‘HDL cholesterol’ (also in mg/dL). Divide the triglyceride number by the HDL number. For example: 180 triglycerides divided by 45 HDL equals a ratio of 4.0. Most lab reports list these values clearly in the results section.
Is the trig/HDL ratio the same for everyone?
Research suggests the ratio may be more predictive in certain populations than others. Studies have found it works best as a proxy for insulin resistance in non-Hispanic white and Hispanic populations. In Black individuals, LDL particle characteristics differ in ways that make the ratio a somewhat less reliable signal. Your doctor can help interpret your results in context.
My triglycerides are low but so is my HDL. What does that mean?
Low HDL on its own is considered a cardiovascular risk factor regardless of triglyceride level. Isolated low HDL without elevated triglycerides can have different causes than the insulin resistance pattern — including genetics, lack of aerobic exercise, smoking, or certain medications. It’s worth discussing with your doctor even if the ratio looks acceptable.
How quickly can I improve my trig/HDL ratio?
Triglycerides respond relatively quickly to dietary changes — often within weeks of reducing sugar and refined carbohydrates. HDL responds more slowly and relies heavily on sustained physical activity. A comprehensive lifestyle approach typically shows meaningful improvement in the ratio within 3 to 6 months.
Get Your Free Heart Book
Your Doctor Checks Blood Pressure & Cholesterol: What About the Other 10?
Most heart attacks happen to people whose last checkup came back “fine.” This book covers the 12 risk factors your doctor may not be testing — in plain English, backed by research.
Get the Free Book →* These statements have not been evaluated by the Food and Drug Administration. This product is not intended to diagnose, treat, cure, or prevent any disease.